The practice of neglecting the neglected men is present in most of the statistics presented by the governmental bodies. Otherwise how does lack of particular facility to men & boys of country doesn’t have any impact on rating of the country while lack of same facility to women attracts negative points in rating of the country.
Eg. In UN Gender development Index the ratio used for calculating Gender development index (GDI = HDIf/HDIm) is geared to show even decrease in the development of males as positive indication towards gender development.
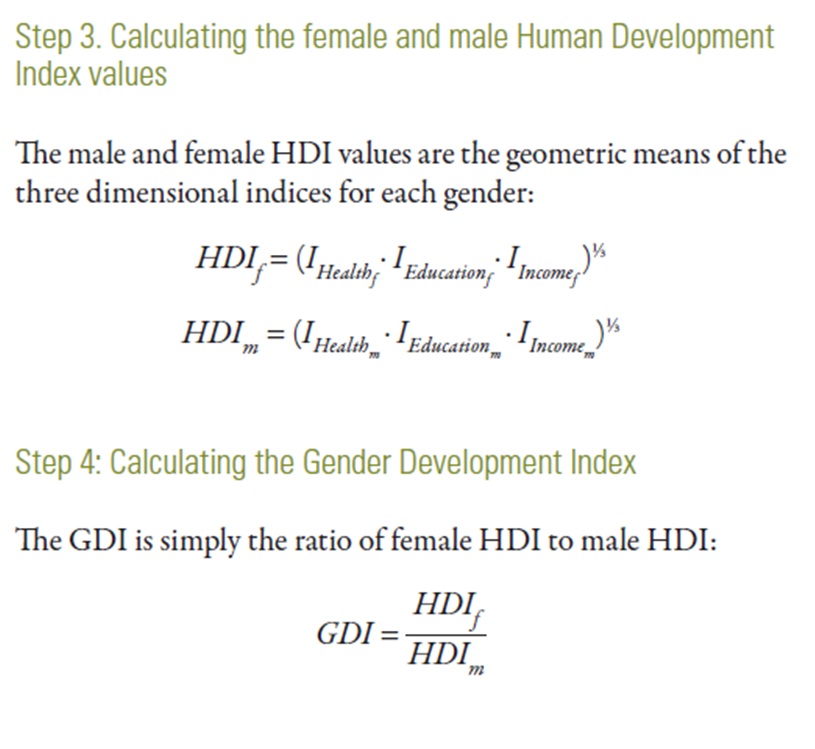
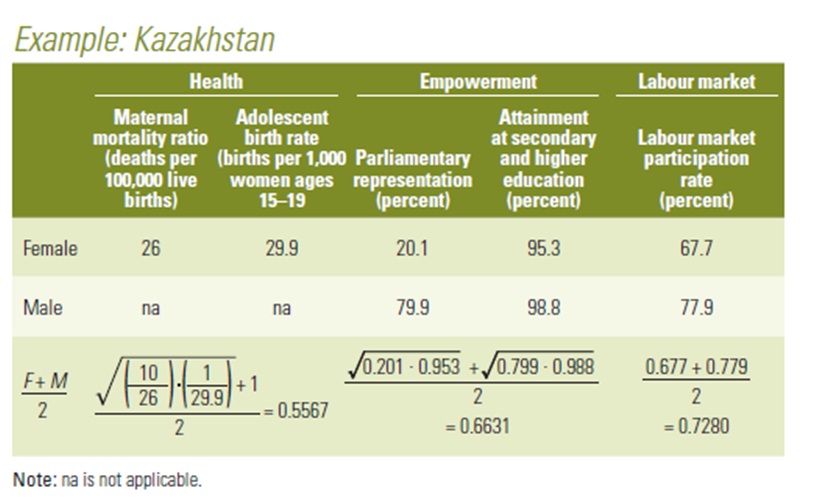
Another example is for health measurement, they have added maternal mortality ratio factor but ignored any male related factor, secondly they measure empowerment by parliamentary representation that totally depends on the effectiveness of the political candidate not the gender. How can you expect people to vote for candidate just by their gender even if the candidate has no leadership qualities or is not able to connect with the people.
Even in slavery index prepared by ILO the girls who get married early are considered as part of population suffering from slavery but the boys who are forced to marry early or are forced to pay marital penalty (maintenance, alimony) like slaves paid their masters are not at all considered suffering from slavery.
So I decided to rank countries using a measure that is independent of such flaws. I will call this measure as measure of “Life Gap” in a country.
The reasons for using life length for such ranking are as follows.
1) Length of life is the result of large number of factors that really mattered in life of a person. It includes but is not limited to the general well-being of individuals, societies development, access to quality healthcare, employment, quality of life, standard of living, level of wealth, comfort, material goods, necessities, available income, poverty rate, quality and affordability of housing, hours of work required to purchase necessities, gross domestic product, inflation rate, number of holiday days per year, affordable (or free), quality and availability of education, incidence of disease, cost of goods and services, infrastructure, national economic growth, economic and political stability, political and religious freedom, environmental quality, climate and safety, happiness and misery, infant mortality, differences in public health, diet, crime and accidents too.
2) This cannot be twisted like the example of skewed statistics given at start of this blog.
3) Suicide as a factor of emotional well being is neglected for gender development but it also affects the life span of people.
4) Though maternal death are considered in Human development index, Death of men due to men specific issues are neglected. Also men are more likely to die from injuries such as occupational, war or accidents as men are forced to work in hazardous situation but this disparity is not counted anywhere and ultimately results affecting their life span by shortening it.
3) Before 1880 death rates of men and women were the same. But starting around 1880, death rates decreased faster among women, leading to differences in mortality rates between males and females. In people born after 1900, the death rate of 50- to 70-year-old men was double that of women of the same age. So something must have definitely gone wrong with the men that years from their life are snuffed off early. http://www.livescience.com/51455-women-outlive-men.html Though cardiovascular disease and other ailments are blamed as cause of the higher death rates among men, It is silly to accept it as Factors like maternal death etc that are only related to women are considered in life expectancy but factors related to men are ignored. Also men would be more vulnerable to cardiovascular disease or any other diseases only if they did not get adequate support from society in terms of medical care, emotional support, legal protection or other forms of benefits that women are enjoying.
The basis I will use for this ranking is length of life of country’s men & women coupled with the difference in length of life of male & female as a measure of a country’s equality in treatment towards both genders of its population. The longer is life of men and lesser is the difference in life expectancy between men and women the better is the rank of the country.
I have used the data of length of life for the years 1990, 2000, 2012 and 2013 my findings are-
For the year 2013, out of 194 countries analyzed, men are neglected in 198 countries and die before women.
Only in four countries Niger, Mali, Swaziland and Sierra Leone the men were able to live as long as women
Only in one country Tonga did the men outlive women.
When the countries are ranked with respect to life span of men and further in order of decreased difference in life expectancy of men and women. USA stands at 43, India at 134 and Russia at 150.
| Life gap Rank | Country | Male | Female |
| 6 | Canada | 80 | 84 |
| 12 | Italy | 80 | 85 |
| 15 | Japan | 80 | 87 |
| 18 | Germany | 79 | 83 |
| 21 | United Kingdom of Great Britain and Northern Ireland | 79 | 83 |
| 24 | France | 79 | 85 |
| 43 | United States of America | 76 | 81 |
| 51 | China | 74 | 77 |
| 83 | Brazil | 72 | 79 |
| 134 | India | 65 | 68 |
| 150 | Russian Federation | 63 | 75 |
If the countries are rated purely on the ratio of life expectancy of man/ life expectancy of woman the disparity against men in top economies get exposed of grossly neglecting their male population compared to the females. USA ranks at 108, India is at 45 and Russia at 194 right at the bottom. Russian man’s life is staggering 12 years short compared to Russian woman. Isn’t this disparity outrageous? The contribution of the men in GDP of these top economies have totally gone unnoticed, and their early death is accepted by both men and women. These findings also expose the negative publicity and rumor mongering by feminist for countries like Russia & China blaming them for neglecting women, the fact is they are neglecting men.
| Life gap Rating | Country | Male | Female | Ratio of M/F |
| 40 | China | 74 | 77 | 0.961039 |
| 45 | India | 65 | 68 | 0.955882 |
| 57 | Canada | 80 | 84 | 0.952381 |
| 67 | Germany | 79 | 83 | 0.951807 |
| 70 | United Kingdom of Great Britain and Northern Ireland | 79 | 83 | 0.951807 |
| 100 | Italy | 80 | 85 | 0.941176 |
| 108 | United States of America | 76 | 81 | 0.938272 |
| 126 | France | 79 | 85 | 0.929412 |
| 148 | Japan | 80 | 87 | 0.91954 |
| 156 | Brazil | 72 | 79 | 0.911392 |
| 194 | Russian Federation | 63 | 75 | 0.84 |
These disparities in life expectancy “Life Gap” between in men and women are demonstrating the need for the men who actually need better medical care, increased social support and legal protection across the globe.
The Life Gap has to be addressed before wage gap, pay gap, health or any other gap. As Life Gap is real unlike many other imaginary gaps that are crafted for siphoning money and fulfill oblique motives
For the reference of my readers I have tabulated the life expectancy of men and women of various countries for the year 2013 and the difference in life expectancy ( male – female ) for the years 2013, 2012, 2000 and 1990 in the following table.
| Life Gap Rank | Country |
Male | Female | M-F | M-F | M-F | M-F |
| 2013 | 2013 | 2013 | 2012 | 2000 | 1990 | ||
| 1 | San Marino | 83 | 84 | -1 | -2 | -7 | -7 |
| 2 | Iceland | 81 | 84 | -3 | -3 | -4 | -6 |
| 3 | Israel | 81 | 84 | -3 | -4 | -4 | -4 |
| 4 | Switzerland | 81 | 85 | -4 | -4 | -6 | -7 |
| 5 | Singapore | 81 | 85 | -4 | -5 | -5 | -5 |
| 6 | Canada | 80 | 84 | -4 | -4 | -5 | -7 |
| 7 | Cyprus | 80 | 84 | -4 | -4 | -4 | -5 |
| 8 | Luxembourg | 80 | 84 | -4 | -4 | -6 | -7 |
| 9 | Norway | 80 | 84 | -4 | -4 | -6 | -6 |
| 10 | Sweden | 80 | 84 | -4 | -4 | -4 | -6 |
| 11 | New Zealand | 80 | 84 | -4 | -4 | -5 | -5 |
| 12 | Italy | 80 | 85 | -5 | -5 | -6 | -6 |
| 13 | Australia | 80 | 85 | -5 | -4 | -6 | -6 |
| 14 | Spain | 80 | 86 | -6 | -6 | -7 | -8 |
| 15 | Japan | 80 | 87 | -7 | -7 | -7 | -6 |
| 16 | Qatar | 79 | 80 | -1 | -1 | 1 | -2 |
| 17 | Malta | 79 | 82 | -3 | -4 | -4 | -4 |
| 18 | Germany | 79 | 83 | -4 | -5 | -6 | -7 |
| 19 | Ireland | 79 | 83 | -4 | -4 | -5 | -6 |
| 20 | Netherlands | 79 | 83 | -4 | -4 | -5 | -6 |
| 21 | United Kingdom of Great Britain and Northern Ireland | 79 | 83 | -4 | -4 | -4 | -6 |
| 22 | Austria | 79 | 84 | -5 | -5 | -6 | -7 |
| 23 | Greece | 79 | 84 | -5 | -5 | -5 | -5 |
| 24 | France | 79 | 85 | -6 | -6 | -8 | -9 |
| 25 | Monaco | 79 | 85 | -6 | -7 | -8 | -7 |
| 26 | Andorra | 79 | 86 | -7 | -7 | -7 | -7 |
| 27 | Kuwait | 78 | 79 | -1 | -1 | -2 | -1 |
| 28 | Denmark | 78 | 82 | -4 | -4 | -4 | -6 |
| 29 | Lebanon | 78 | 82 | -4 | -4 | -3 | -7 |
| 30 | Belgium | 78 | 83 | -5 | -5 | -6 | -6 |
| 31 | Finland | 78 | 84 | -6 | -6 | -7 | -8 |
| 32 | Portugal | 78 | 84 | -6 | -7 | -7 | -7 |
| 33 | Republic of Korea | 78 | 85 | -7 | -7 | -7 | -8 |
| 34 | Maldives | 77 | 79 | -2 | -2 | -1 | 3 |
| 35 | Cuba | 77 | 80 | -3 | -5 | -4 | -3 |
| 36 | Costa Rica | 77 | 81 | -4 | -4 | -3 | -3 |
| 37 | Chile | 77 | 83 | -6 | -6 | -6 | -7 |
| 38 | Slovenia | 77 | 84 | -7 | -6 | -8 | -8 |
| 39 | Bahrain | 76 | 78 | -2 | -2 | -3 | -2 |
| 40 | United Arab Emirates | 76 | 78 | -2 | -2 | -2 | -2 |
| 41 | Peru | 76 | 79 | -3 | -4 | -4 | -4 |
| 42 | Brunei Darussalam | 76 | 79 | -3 | -2 | -5 | -4 |
| 43 | United States of America | 76 | 81 | -5 | -5 | -6 | -7 |
| 44 | Bosnia and Herzegovina | 75 | 80 | -5 | -5 | -6 | -5 |
| 45 | Barbados | 75 | 81 | -6 | -6 | -6 | -6 |
| 46 | Colombia | 75 | 81 | -6 | -7 | -9 | -8 |
| 47 | Croatia | 75 | 81 | -6 | -7 | -7 | -7 |
| 48 | Czech Republic | 75 | 81 | -6 | -6 | -6 | -7 |
| 49 | Nauru | 75 | 83 | -8 | -8 | -8 | -8 |
| 50 | Tonga | 74 | 70 | 4 | 5 | -3 | -10 |
| 51 | China | 74 | 77 | -3 | -3 | -3 | -4 |
| 52 | The former Yugoslav republic of Macedonia | 74 | 78 | -4 | -5 | -5 | -5 |
| 53 | Montenegro | 74 | 78 | -4 | -5 | -5 | -6 |
| 54 | Saudi Arabia | 74 | 78 | -4 | -4 | -4 | -4 |
| 55 | Tunisia | 74 | 78 | -4 | -4 | -4 | -3 |
| 56 | Cook Islands | 74 | 78 | -4 | -5 | -6 | -5 |
| 57 | Oman | 74 | 79 | -5 | -4 | -4 | -4 |
| 58 | Panama | 74 | 80 | -6 | -6 | -5 | -4 |
| 59 | Suriname | 74 | 80 | -6 | -5 | -6 | -5 |
| 60 | Uruguay | 74 | 81 | -7 | -8 | -8 | -7 |
| 61 | Dominican Republic | 73 | 74 | -1 | -2 | -2 | -2 |
| 62 | Albania | 73 | 76 | -3 | -2 | -5 | -4 |
| 63 | Antigua and Barbuda | 73 | 77 | -4 | -4 | -2 | -2 |
| 64 | Libya | 73 | 77 | -4 | -4 | -4 | -3 |
| 65 | Bahamas | 73 | 78 | -5 | -6 | -7 | -5 |
| 66 | Mexico | 73 | 78 | -5 | -6 | -5 | -7 |
| 67 | Syrian Arab Republic | 73 | 78 | -5 | -14 | -3 | -2 |
| 68 | Ecuador | 73 | 79 | -6 | -5 | -6 | -5 |
| 69 | Argentina | 73 | 80 | -7 | -6 | -7 | -7 |
| 70 | Poland | 73 | 81 | -8 | -8 | -8 | -9 |
| 71 | Saint Vincent and the Grenadines | 72 | 76 | -4 | -4 | -6 | -6 |
| 72 | Iran (Islamic Republic of) | 72 | 76 | -4 | -4 | -2 | -1 |
| 73 | Jordan | 72 | 76 | -4 | -3 | -3 | -3 |
| 74 | Malaysia | 72 | 76 | -4 | -4 | -5 | -5 |
| 75 | Dominica | 72 | 77 | -5 | -5 | -3 | -4 |
| 76 | Honduras | 72 | 77 | -5 | -5 | -4 | -4 |
| 77 | Jamaica | 72 | 77 | -5 | -5 | -7 | -5 |
| 78 | Serbia | 72 | 77 | -5 | -5 | -6 | -6 |
| 79 | Belize | 72 | 78 | -6 | -6 | -7 | -5 |
| 80 | Paraguay | 72 | 78 | -6 | -6 | -6 | -5 |
| 81 | Sri Lanka | 72 | 78 | -6 | -7 | -10 | -10 |
| 82 | Niue | 72 | 78 | -6 | -6 | -6 | -6 |
| 83 | Brazil | 72 | 79 | -7 | -7 | -7 | -7 |
| 84 | Saint Lucia | 72 | 79 | -7 | -8 | -6 | -4 |
| 85 | Turkey | 72 | 79 | -7 | -6 | -7 | -6 |
| 86 | Venezuela (Bolivarian Republic of) | 72 | 80 | -8 | -8 | -6 | -4 |
| 87 | Slovakia | 72 | 80 | -8 | -8 | -8 | -9 |
| 88 | Estonia | 72 | 82 | -10 | -10 | -11 | -11 |
| 89 | Vanuatu | 71 | 74 | -3 | -4 | -4 | -3 |
| 90 | Palau | 71 | 75 | -4 | -4 | -3 | -3 |
| 91 | Nicaragua | 71 | 77 | -6 | -6 | -6 | -6 |
| 92 | Cabo Verde | 71 | 78 | -7 | -7 | -7 | -5 |
| 93 | Saint Kitts and Nevis | 71 | 78 | -7 | -7 | -6 | -6 |
| 94 | Bulgaria | 71 | 78 | -7 | -7 | -7 | -7 |
| 95 | Georgia | 71 | 78 | -7 | -8 | -8 | -8 |
| 96 | Romania | 71 | 78 | -7 | -7 | -7 | -7 |
| 97 | Thailand | 71 | 79 | -8 | -8 | -9 | -6 |
| 98 | Hungary | 71 | 79 | -8 | -8 | -8 | -9 |
| 99 | Viet Nam | 71 | 80 | -9 | -9 | -9 | -9 |
| 100 | Bangladesh | 70 | 72 | -2 | -2 | 0 | 1 |
| 101 | Algeria | 70 | 74 | -4 | -3 | -3 | -3 |
| 102 | Azerbaijan | 70 | 75 | -5 | -6 | -5 | -6 |
| 103 | Cambodia | 70 | 75 | -5 | -5 | -5 | -6 |
| 104 | Grenada | 70 | 77 | -7 | -8 | -6 | -7 |
| 105 | Samoa | 70 | 77 | -7 | -7 | -7 | -6 |
| 106 | Mauritius | 70 | 78 | -8 | -8 | -7 | -8 |
| 107 | Seychelles | 70 | 78 | -8 | -9 | -10 | -11 |
| 108 | Indonesia | 69 | 73 | -4 | -4 | -4 | -4 |
| 109 | Morocco | 69 | 73 | -4 | -4 | -4 | -3 |
| 110 | Egypt | 69 | 74 | -5 | -5 | -5 | -4 |
| 111 | Latvia | 69 | 79 | -10 | -10 | -11 | -10 |
| 112 | Lithuania | 69 | 79 | -10 | -12 | -11 | -10 |
| 113 | Bhutan | 68 | 69 | -1 | -1 | 0 | 0 |
| 114 | Tajikistan | 68 | 70 | -2 | -2 | -2 | -3 |
| 115 | Micronesia (Federated States of) | 68 | 70 | -2 | -2 | -2 | -2 |
| 116 | Marshall Islands | 68 | 73 | -5 | -4 | -4 | -4 |
| 117 | Guatemala | 68 | 75 | -7 | -7 | -7 | -5 |
| 118 | El Salvador | 68 | 77 | -9 | -9 | -8 | -9 |
| 119 | Nepal | 67 | 70 | -3 | -2 | -2 | -1 |
| 120 | Solomon Islands | 67 | 70 | -3 | -3 | -3 | -2 |
| 121 | Uzbekistan | 67 | 72 | -5 | -5 | -6 | -7 |
| 122 | Fiji | 67 | 73 | -6 | -6 | -5 | -4 |
| 123 | Trinidad and Tobago | 67 | 74 | -7 | -7 | -7 | -6 |
| 124 | Iraq | 67 | 74 | -7 | -8 | -5 | -4 |
| 125 | Armenia | 67 | 75 | -8 | -8 | -6 | -8 |
| 126 | Namibia | 66 | 70 | -4 | -5 | 0 | -2 |
| 127 | Tuvalu | 66 | 70 | -4 | -4 | -4 | -5 |
| 128 | Democratic People’s Republic of Korea | 66 | 73 | -7 | -7 | -9 | -7 |
| 129 | Kyrgyzstan | 66 | 73 | -7 | -7 | -7 | -7 |
| 130 | Republic of Moldova | 66 | 75 | -9 | -9 | -7 | -7 |
| 131 | Ukraine | 66 | 76 | -10 | -10 | -11 | -10 |
| 132 | Belarus | 66 | 78 | -12 | -11 | -12 | -10 |
| 133 | Pakistan | 65 | 67 | -2 | -2 | -2 | -2 |
| 134 | India | 65 | 68 | -3 | -4 | -2 | -1 |
| 135 | Lao People’s Democratic Republic | 65 | 68 | -3 | -3 | -3 | -3 |
| 136 | Sao Tome and Principe | 65 | 69 | -4 | -4 | -4 | -4 |
| 137 | Timor-Leste | 65 | 69 | -4 | -3 | -2 | -3 |
| 138 | Bolivia (Plurinational State of) | 65 | 70 | -5 | -5 | -4 | -4 |
| 139 | Philippines | 65 | 72 | -7 | -7 | -7 | -7 |
| 140 | Rwanda | 64 | 67 | -3 | -3 | -1 | -4 |
| 141 | Myanmar | 64 | 68 | -4 | -4 | -4 | -4 |
| 142 | Kiribati | 64 | 69 | -5 | -5 | -5 | -5 |
| 143 | Mongolia | 64 | 72 | -8 | -8 | -6 | -6 |
| 144 | Botswana | 63 | 65 | -2 | -2 | 1 | -1 |
| 145 | Ethiopia | 63 | 66 | -3 | -3 | -3 | -6 |
| 146 | Madagascar | 63 | 66 | -3 | -3 | -2 | -3 |
| 147 | Senegal | 63 | 66 | -3 | -3 | -3 | -3 |
| 148 | Yemen | 63 | 66 | -3 | -3 | -3 | -3 |
| 149 | Kazakhstan | 63 | 73 | -10 | -9 | -10 | -9 |
| 150 | Russian Federation | 63 | 75 | -12 | -12 | -13 | -11 |
| 151 | Ghana | 62 | 64 | -2 | -3 | -2 | -3 |
| 152 | Gabon | 62 | 65 | -3 | -2 | -1 | -3 |
| 153 | Mauritania | 62 | 65 | -3 | -4 | -3 | -3 |
| 154 | Afghanistan | 61 | 62 | -1 | -3 | -2 | -1 |
| 155 | Liberia | 61 | 63 | -2 | -3 | -2 | -7 |
| 156 | Haiti | 61 | 64 | -3 | -3 | -2 | -4 |
| 157 | United Republic of Tanzania | 61 | 65 | -4 | -4 | -1 | -3 |
| 158 | Sudan | 61 | 65 | -4 | -4 | -3 | -3 |
| 159 | Eritrea | 61 | 66 | -5 | -5 | -15 | -4 |
| 160 | Comoros | 60 | 63 | -3 | -3 | -3 | -4 |
| 161 | Gambia | 60 | 63 | -3 | -4 | -3 | -3 |
| 162 | Kenya | 60 | 63 | -3 | -3 | -2 | -4 |
| 163 | Djibouti | 60 | 63 | -3 | -3 | -4 | -4 |
| 164 | Papua New Guinea | 60 | 65 | -5 | -5 | -5 | -6 |
| 165 | Guyana | 60 | 67 | -7 | -7 | -5 | -8 |
| 166 | Turkmenistan | 60 | 68 | -8 | -7 | -7 | -6 |
| 167 | Niger | 59 | 59 | 0 | 0 | 0 | 0 |
| 168 | Burkina Faso | 58 | 59 | -1 | -2 | -1 | -3 |
| 169 | Congo | 58 | 60 | -2 | -3 | -1 | -3 |
| 170 | Malawi | 58 | 61 | -3 | -2 | 1 | -3 |
| 171 | Mali | 57 | 57 | 0 | 0 | 0 | 0 |
| 172 | Guinea | 57 | 59 | -2 | -2 | -2 | -2 |
| 173 | Benin | 57 | 60 | -3 | -3 | -3 | -5 |
| 174 | Togo | 57 | 60 | -3 | -2 | -2 | -3 |
| 175 | Zambia | 57 | 60 | -3 | -3 | -3 | -7 |
| 176 | Uganda | 57 | 61 | -4 | -2 | -2 | -5 |
| 177 | South Africa | 57 | 64 | -7 | -6 | -7 | -7 |
| 178 | Cameroon | 56 | 58 | -2 | -2 | -2 | -3 |
| 179 | Zimbabwe | 56 | 61 | -5 | -4 | 0 | -4 |
| 180 | Equatorial Guinea | 55 | 57 | -2 | -3 | -3 | -3 |
| 181 | South Sudan | 55 | 57 | -2 | -2 | -3 | -3 |
| 182 | Nigeria | 54 | 55 | -1 | -2 | -1 | -2 |
| 183 | Burundi | 54 | 58 | -4 | -3 | -4 | -3 |
| 184 | Swaziland | 53 | 53 | 0 | -3 | -1 | 1 |
| 185 | Guinea-Bissau | 53 | 55 | -2 | -3 | -2 | -5 |
| 186 | Mozambique | 53 | 55 | -2 | -2 | -3 | -4 |
| 187 | Somalia | 53 | 56 | -3 | -4 | -3 | -5 |
| 188 | Cote d’Ivoire | 52 | 54 | -2 | -2 | -2 | -4 |
| 189 | Chad | 51 | 53 | -2 | -2 | -2 | -4 |
| 190 | Democratic Republic of the Congo | 51 | 54 | -3 | -3 | -3 | -3 |
| 191 | Central African Republic | 50 | 52 | -2 | -2 | -2 | -4 |
| 192 | Angola | 50 | 53 | -3 | -2 | -3 | -4 |
| 193 | Lesotho | 48 | 52 | -4 | -3 | -2 | -3 |
| 194 | Sierra Leone | 46 | 46 | 0 | -1 | -1 | 0 |
Ref – http://apps.who.int/gho/athena/data/GHO/WHOSIS_000002,WHOSIS_000001,WHOSIS_000015?filter=COUNTRY:*;REGION:AFR;REGION:AMR;REGION:SEAR;REGION:EUR;REGION:EMR;REGION:WPR;SEX:*&format=xml&profile=excel
Leave a Reply